[1]:
%matplotlib inline
Utilities for writing h5USID files
Suhas Somnath
4/18/2018
This document illustrates the many handy functions in pyUSID.hdf_utils that significantly simplify writing data and information into Universal Spectroscopy and Imaging Data (USID) HDF5 files (h5USID files)
Note: Most of the functions demonstrated in this notebook have been moved out of pyUSID.hdf_utils and into sidpy.hdf ## Introduction The USID model uses a data-centric approach to data analysis and processing meaning that results from all data analysis and processing are written to the same h5 file that contains the recorded measurements. The Hierarchical Data Format (HDF5) allows data, whether it is raw measured data or results of analysis, to be stored in multiple datasets within the
same file in a tree-like manner. Certain rules and considerations have been made in pyUSID to ensure consistent and easy access to any data.
The h5py python package provides great functions to create, read, and manage data in HDF5 files. In pyUSID.hdf_utils, we have added functions that facilitate scientifically relevant, or pyUSID specific functionality such as easy creation of USID Main datasets, creation of automatically indexed groups to hold results of an analysis, etc. Due to the wide breadth of the functions in hdf_utils, the guide for hdf_utils will be split in two parts - one that focuses on functions that facilitate
reading and one that facilitate writing of data. The following guide provides examples of how, and more importantly when, to use functions in pyUSID.hdf_utils for various scenarios starting from recording data from instruments to storing analysis data.
Recommended pre-requisite reading
Utilities for reading h5USID files using pyUSID
Import all necessary packages
Before we begin demonstrating the numerous functions in pyUSID.hdf_utils, we need to import the necessary packages. Here are a list of packages besides pyUSID that will be used in this example:
h5py- to open and close the filenumpy- for numerical operations on arrays in memorymatplotlib- basic visualization of data
[2]:
from __future__ import print_function, division, unicode_literals
import subprocess
import sys
def install(package):
    subprocess.call([sys.executable, "-m", "pip", "install", package])

import os
# Warning package in case something goes wrong
from warnings import warn
import h5py
import numpy as np
import matplotlib.pyplot as plt

# import sidpy - supporting package for pyUSID:
try:
    import sidpy
except ImportError:
    warn('sidpy not found.  Will install with pip.')
    import pip
    install('sidpy')
    import sidpy

# Finally import pyUSID:
try:
    import pyUSID as usid
except ImportError:
    warn('pyUSID not found.  Will install with pip.')
    import pip
    install('pyUSID')
    import pyUSID as usid
Create a HDF5 file
We will be using the h5py functionality to do basic operations on HDF5 files
[3]:
file_path = 'test.h5'
h5_file = h5py.File(file_path, mode='w')
HDF_Utils works with (and uses) h5py
sidpy and hdf_utils do not preclude the creation of groups and datasets using the h5py package. However, the many functions in hdf_utils are present to make it easier to handle the reading and writing of multidimensional scientific data formatted according to the USID model.
We can always use the h5py functionality to create a HDF5 group as shown below:
[4]:
h5_some_group = h5_file.create_group('Some_Group')
print(h5_some_group)
<HDF5 group "/Some_Group" (0 members)>
In the same way, we can also continue to create HDF5 datasets using h5py:
[5]:
h5_some_dataset = h5_some_group.create_dataset('Some_Dataset', np.arange(5))
print(h5_some_dataset)
<HDF5 dataset "Some_Dataset": shape (0, 1, 2, 3, 4), type "<f4">
Create Groups
create_indexed_group()
In order to accommodate the iterative nature of data recording (multiple sequential and related measurements) and analysis (same analysis performed with different parameters) we add an index as a suffix to HDF5 Group names.
Let us first create a HDF5 group to store some data recorded from an instrument. The below function will automatically create a group with an index as a suffix and write certain book-keeping attributes to the group. We will see how this and similar functions handle situations when similarly named groups already exist.
[6]:
h5_meas_group = sidpy.prov_utils.create_indexed_group(h5_file, 'Measurement')
print(h5_meas_group)
<HDF5 group "/Measurement_000" (0 members)>
Since there were no other groups whose name started with Measurement, the function assigned the lowest index - 000 as a suffix to the requested group name. Note that the - character is not allowed in the names of the groups since it will be used as the separator character in other functions. This will be made clear when discussing the create_results_group() function later.
create_indexed_group() calls another handy function called assign_group_index( to get the suffix before creating a HDF5 group. Should we want to create another new indexed group called Measurement, assign_group_index() will notice that a group named Measurement_000 already exists and will assign the next index (001) to the new group - see below. Note that assign_group_index() does not create the group; it only assigns a non-conflicting string name for the group.
[7]:
print(sidpy.prov_utils.assign_group_index(h5_file, 'Measurement'))
Measurement_001
Now lets look at datasets and groups in the created file:
[8]:
print('Contents within the file so far:')
sidpy.hdf_utils.print_tree(h5_file)
Contents within the file so far:
/
├ Measurement_000
  ---------------
├ Some_Group
  ----------
  ├ Some_Dataset
Clearly, we have the Measurement_000 Group at the same level as a group named Some_Group. The group Some_Group contains a dataset named Some_Dataset under it.
Both, Measurement_000 and Some_Group have an underline below their name to indicate that they are groups unlike the Some_Dataset Dataset
Writing attributes
HDF5 datasets and groups can also store metadata such as experimental parameters. These metadata can be text, numbers, small lists of numbers or text etc. These metadata can be very important for understanding the datasets and guide the analysis routines.
While one could use the basic h5py functionality to write and access attributes, one would encounter a lot of problems when attempting to encode or decode attributes whose values were strings or lists of strings due to some issues in h5py. This problem has been demonstrated in our primer to HDF5 <../beginner/plot_h5py.html>. Instead of using the basic functionality of h5py, we recommend always using the functions in pyUSID that work reliably and consistently for any kind of attribute
for any version of python:
Here’s a look at the (self-explanatory), default attributes that will be written to the indexed group for traceability and posterity. Note that we are using pyUSID’s get_attributes() function instead of the base h5py capability
[9]:
print('Attributes contained within {}'.format(h5_meas_group))
for key, val in sidpy.hdf_utils.get_attributes(h5_meas_group).items():
    print('\t%s : %s' % (key, val))
Attributes contained within <HDF5 group "/Measurement_000" (0 members)>
        machine_id : fv-az1691-747
        platform : Linux-6.8.0-1021-azure-x86_64-with-glibc2.39
        sidpy_version : 0.12.6
        timestamp : 2025_03_07-22_01_38
Note that these book-keeping attributes written by create_indexed_group() are not written when using h5py’s create_group() function to create a regular group.
[10]:
print('Attributes contained in the basic group created using h5py: {}'.format(h5_some_group))
print(sidpy.hdf_utils.get_attributes(h5_some_group))
Attributes contained in the basic group created using h5py: <HDF5 group "/Some_Group" (1 members)>
{}
write_book_keeping_attrs()
However, you can always manually add these basic attributes after creating the group using the write_book_keeping_attrs(). Note that we can add these basic attributes to Datasets as well as Groups using this function.
[11]:
sidpy.hdf_utils.write_book_keeping_attrs(h5_some_group)
print('Attributes contained in the basic group after calling write_book_keeping_attrs():')
for key, val in sidpy.hdf_utils.get_attributes(h5_some_group).items():
    print('\t%s : %s' % (key, val))
Attributes contained in the basic group after calling write_book_keeping_attrs():
        machine_id : fv-az1691-747
        platform : Linux-6.8.0-1021-azure-x86_64-with-glibc2.39
        sidpy_version : 0.12.6
        timestamp : 2025_03_07-22_01_38
write_simple_attrs()
Due to the problems in h5py, we use the write_simple_attrs() function to add / modify additional attributes to the group:
[12]:
sidpy.hdf_utils.write_simple_attrs(h5_meas_group, {'Instrument': 'Atomic Force Microscope',
                                                'User': 'Joe Smith',
                                                'Room Temperature [C]': 23})
copy_attributes()
hdf_utils.copy_attributes() is another handy function that simplifies the process of copying attributes from one HDF5 object to another like a Dataset or Group or the file itself. To illustrate, let us copy the attributes from h5_meas_group to h5_some_dataset:
[13]:
print('Attributes in {} before copying attributes:'.format(h5_some_dataset))
for key, val in sidpy.hdf_utils.get_attributes(h5_some_dataset).items():
    print('\t%s : %s' % (key, val))
print('\n------------- COPYING ATTRIBUTES ----------------------------\n')
sidpy.hdf.hdf_utils.copy_attributes(h5_meas_group, h5_some_dataset)
print('Attributes in {}:'.format(h5_some_dataset))
for key, val in sidpy.hdf_utils.get_attributes(h5_some_dataset).items():
    print('\t%s : %s' % (key, val))
Attributes in <HDF5 dataset "Some_Dataset": shape (0, 1, 2, 3, 4), type "<f4"> before copying attributes:

------------- COPYING ATTRIBUTES ----------------------------

Attributes in <HDF5 dataset "Some_Dataset": shape (0, 1, 2, 3, 4), type "<f4">:
        Instrument : Atomic Force Microscope
        Room Temperature [C] : 23
        User : Joe Smith
        machine_id : fv-az1691-747
        platform : Linux-6.8.0-1021-azure-x86_64-with-glibc2.39
        sidpy_version : 0.12.6
        timestamp : 2025_03_07-22_01_38
Writing Main datasets
Set up a toy problem
Let’s set up a toy four-dimensional dataset that has:
two position dimensions:
columns - X
rows - Y
and two spectroscopic dimensions:
(sinusoidal) probing bias waveform
cycles over which this bias waveform is repeated
For simplicity, we will keep the size of each dimension small.
[14]:
num_rows = 3
num_cols = 5
num_cycles = 2
bias_pts = 7
Specify position and spectroscopic dimensions
Next, let us determine how each of the position and spectroscopic dimensions are varied
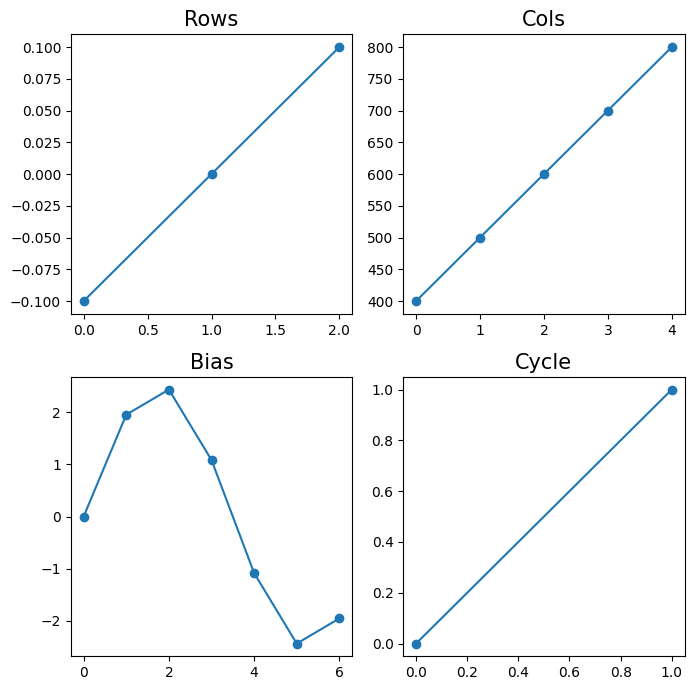
[15]:
rows_vals = np.arange(-0.1, 0.15, 0.1)
cols_vals = np.arange(400, 900, 100)
bias_vals = 2.5 * np.sin(np.linspace(0, 2*np.pi, bias_pts, endpoint=False))
cycle_vals = np.arange(num_cycles)
For better understanding of this dataset, let us take a look at the different values these dimensions can take
[16]:
fig, axes = plt.subplots(ncols=2, nrows=2, figsize=(7, 7))
for axis, vals, dim_name in zip(axes.flat, [rows_vals, cols_vals, bias_vals, cycle_vals],
                                ['Rows', 'Cols', 'Bias', 'Cycle']):
    axis.set_title(dim_name, fontsize=15)
    axis.plot(vals, 'o-')
fig.tight_layout()
In the USID model, position and spectroscopic dimensions are defined using some basic information that will be incorporated in Dimension objects that contain three vial pieces of information:
Name of the dimension
units for the dimension
values:
These can be the actual values over which the dimension was varied
or number of steps in case of linearly varying dimensions such as
Cyclebelow
Note that the Dimension objects in the lists for Positions and Spectroscopic must be arranged from fastest varying to slowest varying to mimic how the data is actually arranged. For example, in this example, there are multiple bias points per cycle and multiple columns per row of data. Thus, the Bias changes faster than the Cycle and the columns change faster than the rows. Therefore, the Cols must come before the Rows and Bias must precede the Cycle dimension:
[17]:
pos_dims = [usid.Dimension('Cols', 'nm', cols_vals),
            usid.Dimension('Rows', 'um', rows_vals)]
spec_dims = [usid.Dimension('Bias', 'V', bias_vals),
             usid.Dimension('Cycle', '', num_cycles)]
write_main_dataset()
Often, data is is recorded (from instruments) or generated (as a result of some analysis) in chunks (for example - one position at a time). Therefore, it makes sense to first create an empty dataset and then fill in the data as it is generated / recorded.
We will only create an empty dataset first by specifying how large the dataset should be and of what data type (specified using the dtype keyword argument). Later, we will go over examples where the whole data is available when creating the HDF5 dataset. The write_main_dataset() is one of the most important and popularly used functions in hdf_utils since it handles:
thorough validation of all inputs
the creation of the central dataset
the creation of the ancillary datasets (if necessary)
linking the ancillary datasets such that the central dataset becomes a
Maindatasetwriting attributes
By default h5py does not appear to compress datasets and datasets (especially Main datasets) can balloon in size if they are not compressed. Therefore, it is recommended that the compression keyword argument is passed as well. gzip is the compression algorithm that is always available with h5py and it does a great job, so we will use this.
We could use the write_simple_attrs() function to write attributes to Raw_Data at a later stage but we can always pass these attributes to be written at the time of dataset creation if they are already known
[18]:
h5_raw = usid.hdf_utils.write_main_dataset(h5_meas_group,  # parent HDF5 group
                                           (num_rows * num_cols, bias_pts * num_cycles),  # shape of Main dataset
                                           'Raw_Data',  # Name of main dataset
                                           'Current',  # Physical quantity contained in Main dataset
                                           'nA',  # Units for the physical quantity
                                           pos_dims,  # Position dimensions
                                           spec_dims,  # Spectroscopic dimensions
                                           dtype=np.float32,  # data type / precision
                                           compression='gzip',
                                           main_dset_attrs={'IO_rate': 4E+6, 'Amplifier_Gain': 9})
print(h5_raw)
<HDF5 dataset "Raw_Data": shape (15, 14), type "<f4">
located at:
        /Measurement_000/Raw_Data
Data contains:
        Current (nA)
Data dimensions and original shape:
Position Dimensions:
        Rows - size: 3
        Cols - size: 5
Spectroscopic Dimensions:
        Cycle - size: 2
        Bias - size: 7
Data Type:
        float32
/opt/hostedtoolcache/Python/3.9.21/x64/lib/python3.9/site-packages/pyUSID/io/hdf_utils/simple.py:1072: UserWarning: In the future write_ind_val_dsets will default to requiring dimensions to be arranged from slowest to fastest varying
  warn('In the future write_ind_val_dsets will default to requiring dimensions to be arranged from slowest to fastest varying')
/opt/hostedtoolcache/Python/3.9.21/x64/lib/python3.9/site-packages/pyUSID/io/hdf_utils/simple.py:1129: UserWarning: pyUSID.io.hdf_utils.simple.write_ind_val_dsets no longer createsregion references for each dimension. Please use pyUSID.io.reg_ref.write_region_references to manually create region references
  warn('pyUSID.io.hdf_utils.simple.write_ind_val_dsets no longer creates'
Let us take a look at the contents of the file again using the print_tree() function. What we see is that five new datasets have been created:
Raw_Datawas created to contain the 4D measurement we are interested in storing.Spectroscopic_Indicesand Spectroscopic_Values`` contain the information about the spectroscopic dimensionsPosition_IndicesandPosition_Valuescontain the position related information
The underline below Measurement_000 indicates that this is a HDF5 Group
[19]:
sidpy.hdf_utils.print_tree(h5_file)
/
├ Measurement_000
  ---------------
  ├ Position_Indices
  ├ Position_Values
  ├ Raw_Data
  ├ Spectroscopic_Indices
  ├ Spectroscopic_Values
├ Some_Group
  ----------
  ├ Some_Dataset
As mentioned in our document about the USID model <../../data_format.html>, the four supporting datasets (Indices and Values datasets for Position and Spectroscopic) help provide meaning to each element in Raw_Data such as dimensionality, etc.
Only Raw_Data is a USID Main dataset while all other datasets are just supporting datasets. We can verify whether a dataset is a Main dataset or not using the check_if_main() function:
[20]:
for dset in [h5_raw, h5_raw.h5_spec_inds, h5_raw.h5_pos_vals]:
    print('Is {} is a Main dataset?: {}'.format(dset.name, usid.hdf_utils.check_if_main(dset)))
Is /Measurement_000/Raw_Data is a Main dataset?: True
Is /Measurement_000/Spectroscopic_Indices is a Main dataset?: False
Is /Measurement_000/Position_Values is a Main dataset?: False
Populating the Dataset:
Note that h5_main still does not contain the values we are interested in filling it in with:
[21]:
print(h5_raw[5])
[0. 0. 0. 0. 0. 0. 0. 0. 0. 0. 0. 0. 0. 0.]
Let us simulate a situation where we are recording the data a pixel at a time and writing it to the h5_main dataset:
[22]:
source_main_data = np.random.rand(num_rows * num_cols, bias_pts * num_cycles)

for pixel_ind, pixel_data in enumerate(source_main_data):
    h5_raw[pixel_ind] = pixel_data

# Make sure to ``flush`` the file (write anything in the buffer into the file)
h5_file.flush()
Note that we were only simulating a (realistic) situation where all the data was not present at once to write into Raw_Data dataset. Let us check the contents at a particular position in the dataset now:
[23]:
print(h5_raw[5])
[0.57908833 0.6056317  0.57019556 0.79568505 0.89794546 0.5628234
 0.36636862 0.49692482 0.07369512 0.89194983 0.87636715 0.68721926
 0.04470357 0.20441724]
Exploring attributes in Main datasets:
Some of the main requirements for promoting a regular dataset to a Main dataset are some mandatory attributes attached to the dataset:
quantity - What the stored data contains - for example: current, temperature, voltage, strain etc.
units - the units for the quantity, such as Amperes, meters, etc.
links to each of the four ancillary datasets
Again, we can use the get_attributes() function to see if and how these attributes are stored:
[24]:
for key, val in sidpy.hdf_utils.get_attributes(h5_raw).items():
    print('{} : {}'.format(key, val))
Amplifier_Gain : 9
IO_rate : 4000000.0
Position_Indices : <HDF5 object reference>
Position_Values : <HDF5 object reference>
Spectroscopic_Indices : <HDF5 object reference>
Spectroscopic_Values : <HDF5 object reference>
machine_id : fv-az1691-747
platform : Linux-6.8.0-1021-azure-x86_64-with-glibc2.39
pyUSID_version : 0.0.12
quantity : Current
sidpy_version : 0.12.6
timestamp : 2025_03_07-22_01_38
units : nA
While it is straightforward to read simple attributes like quantity or units, the values for Position_Values or Spectroscopic_Indices attributes seem cryptic. These are just references or links to other datasets.
[25]:
print(sidpy.hdf_utils.get_attr(h5_raw, 'Position_Indices'))
<HDF5 object reference>
Object references as attributes
We can get access to linked datasets using get_auxiliary_datasets():
[26]:
print(sidpy.hdf_utils.get_auxiliary_datasets(h5_raw, 'Position_Indices'))
[<HDF5 dataset "Position_Indices": shape (15, 2), type "<u4">]
Given that h5_raw is a Main dataset, andPosition_Indices is one of the four essential components of a Main dataset, the USIdataset object makes it far easier to access the ancillary datasets without needing to call a function as above. The USIDataset class <./plot_usi_dataset.html>_ has been discussed in greater detail in a separate document.
What do we do if we need to store some other supporting information regarding some measurement? If such supporting datasets do not need to be USID Main datasets, we could simply use the basic functionality of h5py to create the dataset
[27]:
h5_other = h5_meas_group.create_dataset('Other', np.random.rand(5))
h5USID files tend to have a fair number of datasets in them and the most important ones are Main datasets and users tend to “walk” or “hop” through the file by stepping only on the Main datasets. Thus, we often want to link supporting datasets to the relevant Main datasets. This way, such supporting datasets can be accessed via an attribute of the Main dataset instead of having to manually specify the path of the supporting dataset.
link_h5_objects_as_attrs()
link_h5_objects_as_attrs() makes it easy to link a dataset or group to any other dataset or group. In this example we will link the Other dataset to the Raw_Data dataset:
[28]:
sidpy.hdf_utils.link_h5_objects_as_attrs(h5_raw, h5_other)

for key, val in sidpy.hdf_utils.get_attributes(h5_raw).items():
    print('{} : {}'.format(key, val))
Amplifier_Gain : 9
IO_rate : 4000000.0
Other : <HDF5 object reference>
Position_Indices : <HDF5 object reference>
Position_Values : <HDF5 object reference>
Spectroscopic_Indices : <HDF5 object reference>
Spectroscopic_Values : <HDF5 object reference>
machine_id : fv-az1691-747
platform : Linux-6.8.0-1021-azure-x86_64-with-glibc2.39
pyUSID_version : 0.0.12
quantity : Current
sidpy_version : 0.12.6
timestamp : 2025_03_07-22_01_38
units : nA
In the same way, we can even link a group to the Other dataset:
[29]:
sidpy.hdf_utils.link_h5_objects_as_attrs(h5_other, h5_some_group)

for key, val in sidpy.hdf_utils.get_attributes(h5_other).items():
    print('{} : {}'.format(key, val))
Some_Group : <HDF5 object reference>
What we see above is that ‘Other’ is now an attribute of the ‘Raw_Data’ dataset.
One common scenario in scientific workflows is the storage of multiple Main Datasets within the same group. The first Main dataset can be stored along with its four ancillary datasets without any problems. However, if the second Main dataset also requires the storage of Position and Spectroscopic datasets, these datasets would need to be named differently to avoid conflicts with existing datasets (associated with the first Main dataset). Moreover , these
ancillary datasets would need to be linked to the second Main dataset with the standard Position_.. and Spectroscopic_.. names for the attributes.
link_h5_obj_as_alias()
link_h5_obj_as_alias() is handy in this scenario since it allows a dataset or group to be linked with a name different from its actual name. For example, we can link the Raw_Data dataset to the Other dataset with an alias:
[30]:
sidpy.hdf_utils.link_h5_obj_as_alias(h5_other, h5_raw, 'Mysterious_Dataset')

for key, val in sidpy.hdf_utils.get_attributes(h5_other).items():
    print('{} : {}'.format(key, val))
Mysterious_Dataset : <HDF5 object reference>
Some_Group : <HDF5 object reference>
The dataset named Other has a new attribute named Mysterious_Dataset. Let us show that this dataset is none other than Raw_Data:
[31]:
h5_myst_dset = sidpy.hdf_utils.get_auxiliary_datasets(h5_other, 'Mysterious_Dataset')[0]
print(h5_myst_dset == h5_raw)
True
Processing on Datasets
Lets assume that we are normalizing the data in some way and we need to write the results back to the file. As far as the data shapes and dimensionality are concerned, let us assume that the data still remains a 4D dataset.
create_results_group()
Let us first start off with creation of a HDF5 Group that will contain the results. If you recall, groups that contain the results of some processing / analysis on a source dataset are named as Source_Dataset_name-Process_Name_00x where the index of the group. The create_results_group() function makes it very easy to create a group with such nomenclature and indexing:
[32]:
h5_results_group_1 = sidpy.prov_utils.create_results_group(h5_raw, 'Normalization')
print(h5_results_group_1)
<HDF5 group "/Measurement_000/Raw_Data-Normalization_000" (0 members)>
/opt/hostedtoolcache/Python/3.9.21/x64/lib/python3.9/site-packages/sidpy/hdf/prov_utils.py:122: FutureWarning: The behavior of create_results_group is very likely to change soon and significantly. Use this function with caution
  warn('The behavior of create_results_group is very likely to change soon '
Let us make up some (random) data which is the result of some Normalization on the Raw_Data:
[33]:
norm_data = np.random.rand(num_rows * num_cols, bias_pts * num_cycles)
Writing the main dataset
In this scenario we will demonstrate how one might write a Main dataset when having the complete processed (in this case some normalization) data is available before even creating the dataset.
One more important point to remember here is that the normalized data is of the same shape and dimensionality as Raw_Data. Therefore, we need not unnecessarily create ancillary datasets - we can simply refer to the ones that support Raw_Data. During the creation of Raw_Data, we passed the pos_dims and spec_dims parameters for the creation of new Ancillary datasets. In this case, we will show how we can ask write_main_dataset() to reuse existing ancillary datasets:
[34]:
h5_norm = usid.hdf_utils.write_main_dataset(h5_results_group_1,  # parent group
                                            norm_data,  # data to be written
                                            'Normalized_Data',  # Name of the main dataset
                                            'Current',  # quantity
                                            'nA',  # units
                                            None,  # position dimensions
                                            None,  # spectroscopic dimensions
                                            h5_pos_inds=h5_raw.h5_pos_inds,
                                            h5_pos_vals=h5_raw.h5_pos_vals,
                                            h5_spec_inds=h5_raw.h5_spec_inds,
                                            h5_spec_vals=h5_raw.h5_spec_vals,
                                            compression='gzip')
print(h5_norm)
<HDF5 dataset "Normalized_Data": shape (15, 14), type "<f8">
located at:
        /Measurement_000/Raw_Data-Normalization_000/Normalized_Data
Data contains:
        Current (nA)
Data dimensions and original shape:
Position Dimensions:
        Rows - size: 3
        Cols - size: 5
Spectroscopic Dimensions:
        Cycle - size: 2
        Bias - size: 7
Data Type:
        float64
When we look at the contents of hte file again, what we see below is that the newly created group Raw_Data-Normalization_000 only contains the Normalized_Data dataset and none of the supporting ancillary datasets since it is sharing the same ones created for Raw_Data
[35]:
sidpy.hdf_utils.print_tree(h5_file)
/
├ Measurement_000
  ---------------
  ├ Other
  ├ Position_Indices
  ├ Position_Values
  ├ Raw_Data
  ├ Raw_Data-Normalization_000
    --------------------------
    ├ Normalized_Data
  ├ Spectroscopic_Indices
  ├ Spectroscopic_Values
├ Some_Group
  ----------
  ├ Some_Dataset
create_empty_dataset()
Let us say that we are interested in writing out another dataset that is again of the same shape and dimensionality as Raw_Data or Normalized_Data. There is another way to create an empty dataset identical to an existing dataset, and then fill it in. This approach is an alternative to the approach used for Normalized_Data:
[38]:
h5_offsets = usid.hdf_utils.create_empty_dataset(h5_norm, np.float32, 'Offsets')
print(h5_offsets)
<HDF5 dataset "Offsets": shape (15, 14), type "<f4">
located at:
        /Measurement_000/Raw_Data-Normalization_000/Offsets
Data contains:
        Current (nA)
Data dimensions and original shape:
Position Dimensions:
        Rows - size: 3
        Cols - size: 5
Spectroscopic Dimensions:
        Cycle - size: 2
        Bias - size: 7
Data Type:
        float32
In this very specific scenario, we duplicated practically all aspects of Normalized_Data, including its links to the ancillary datasets. Thus, this h5_offsets automatically also becomes a Main dataset.
However, it is empty and needs to be populated
[39]:
print(h5_offsets[6])
[0. 0. 0. 0. 0. 0. 0. 0. 0. 0. 0. 0. 0. 0.]
Since this is an example, we will populate the dataset using same data prepare for norm_data
[40]:
h5_offsets[()] = norm_data
print(h5_offsets[6])
[0.4262138  0.7230509  0.0779063  0.77554876 0.55999863 0.5518511
 0.22364023 0.61883676 0.04049517 0.8936019  0.25699493 0.94809175
 0.05728537 0.312141  ]
Creating Ancillary datasets
Often, certain processing of data involves the removal of one or more dimensions (typically Spectroscopic). This necessitates careful generation of indices and values datasets. In our example, we will remove the spectroscopic dimension - Bias and leave the position dimensions as is. While we could simply regenerate the spectroscopic indices from scratch knowing that the only remaining spectroscopic dimension is Cycle, this is not feasible when writing robust code where we
have minimal control or knowledge about the other dimensions. This is especially true when there are 3 or more spectroscopic dimensions and we do not know relationships between the spectroscopic dimensions or the rates of change in these spectroscopic dimensions. Fortunately, hdf_utils.write_reduced_spec_dsets() substantially simplifies this problem as shown below.
First, we still need to create the results HDF5 group to hold the results:
[41]:
h5_analysis_group = sidpy.prov_utils.create_results_group(h5_norm, 'Fitting')
Let us take a look at the contents of the HDF5 file again. Clearly, we do not have any new datasets underneath Normalized_Data-Fitting_000
[42]:
sidpy.hdf_utils.print_tree(h5_file)
/
├ Measurement_000
  ---------------
  ├ Other
  ├ Position_Indices
  ├ Position_Values
  ├ Raw_Data
  ├ Raw_Data-Normalization_000
    --------------------------
    ├ Normalized_Data
    ├ Normalized_Data-Fitting_000
      ---------------------------
    ├ Offsets
  ├ Spectroscopic_Indices
  ├ Spectroscopic_Values
├ Some_Group
  ----------
  ├ Some_Dataset
write_reduced_anc_dsets()
Now we make the new spectroscopic indices and values datasets while removing the Bias dimension using the write_reduced_anc_dsets() function. This is especially useful when performing dimensionality reduction statistically (machine learning / simpler methods such as averaging) or by fitting a dimension to some functional form
[43]:
h5_spec_inds, h5_spec_vals = usid.hdf_utils.write_reduced_anc_dsets(h5_analysis_group,
                                                                    h5_norm.h5_spec_inds,
                                                                    h5_norm.h5_spec_vals,
                                                                    'Bias', is_spec=True)
print(h5_spec_inds)
<HDF5 dataset "Spectroscopic_Indices": shape (1, 2), type "<u4">
Let us take a look at the contents only inside h5_analysis_group now. Clearly, we have created two new spectroscopic ancillary datasets.
[44]:
sidpy.hdf_utils.print_tree(h5_analysis_group)
/Measurement_000/Raw_Data-Normalization_000/Normalized_Data-Fitting_000
├ Spectroscopic_Indices
├ Spectroscopic_Values
write_ind_val_dsets()
Similar to write_reduced_spec_dsets(), hdf_utils also has another function called write_ind_val_dsets() that is handy when one needs to create the ancillary datasets before write_main_dataset() is called. For example, consider a data processing algorithm that may or may not change the position dimensions. You may need to structure your code this way:
if position dimensions are unchanged:
  # get links to datasets from the source dataset
  h5_pos_inds, h5_pos_vals = h5_source.h5_pos_inds, h5_source.h5_pos_vals
else:
  # Need to create fresh HDF5 datasets
  h5_pos_inds, h5_pos_vals = write_ind_val_dsets()

# At this point, it does not matter how we got h5_pos_inds, h5_pos_vals. We can simply link them when we
# create the main dataset.
h5_new_main = write_main_dataset(...., h5_pos_inds=h5_pos_inds, h5_pos_vals=h5_pos_vals)
Even though we already decided that we would not be changing the position dimensions for this particular example, we will demonstrate the usage of write_ind_val_dsets() to make position indices and values HDF5 datasets (that are identical to the ones already linked to h5_norm)
[45]:
h5_pos_inds, h5_pos_vals = usid.hdf_utils.write_ind_val_dsets(h5_analysis_group, pos_dims, is_spectral=False)
Looking at the contents of Normalized_Data-Fitting_000 now reveals that we have added the Position datasets as well. However, we still do not have the Main dataset.
[46]:
sidpy.hdf_utils.print_tree(h5_analysis_group)
/Measurement_000/Raw_Data-Normalization_000/Normalized_Data-Fitting_000
├ Position_Indices
├ Position_Values
├ Spectroscopic_Indices
├ Spectroscopic_Values
Finally, we can create and write a Main dataset with some results using the trusty write_main_dataset function. Since we have created both the Spectroscopic and Position HDF5 dataset pairs, we simply ask write_main_dataset() to re-use
link them. This is why the
pos_dimsandspec_dimsarguments are None (we don’t want to create new datasets).
[47]:
reduced_main = np.random.rand(num_rows * num_cols, num_cycles)
h5_cap_1 = usid.hdf_utils.write_main_dataset(h5_analysis_group,  # parent HDF5 group
                                           reduced_main,  # data for Main dataset
                                           'Capacitance',  # Name of Main dataset
                                           'Capacitance',  # Quantity
                                           'pF',  # units
                                           None,  # position dimensions
                                           None,  # spectroscopic dimensions
                                           h5_spec_inds=h5_spec_inds,
                                           h5_spec_vals=h5_spec_vals,
                                           h5_pos_inds=h5_pos_inds,
                                           h5_pos_vals=h5_pos_vals,
                                             compression='gzip')
print(h5_cap_1)
<HDF5 dataset "Capacitance": shape (15, 2), type "<f8">
located at:
        /Measurement_000/Raw_Data-Normalization_000/Normalized_Data-Fitting_000/Capacitance
Data contains:
        Capacitance (pF)
Data dimensions and original shape:
Position Dimensions:
        Rows - size: 3
        Cols - size: 5
Spectroscopic Dimensions:
        Cycle - size: 2
Data Type:
        float64
Multiple Main Datasets
Let’s say that we need to create a new Main dataset within the same folder as Capacitance called Mean_Capacitance. Mean_Capacitance would just be a spatial map with average capacitance, so it would not even have the Cycle spectroscopic dimension. This means that we can reuse the newly created Position ancillary datasets but we would need to create new Spectroscopic_Indices and Spectroscopic_Values datasets in the same folder to express the 0 dimensions in the
spectroscopic axis for this new dataset. However, we already have datasets of this name that we created above using the write_reduced_spec_dsets() function. Recall, that the criterion for a Main dataset is that it should have attributes of name Spectroscopic_Indices and Spectroscopic_Values. It does not matter what the actual name of the linked datasets are. Coming back to the current example, we could simply ask write_main_dataset() to name the spectroscopic datasets
with a different prefix - Empty_Spec instead of Spectroscopic (which is the default) via the aux_spec_prefix keyword argument (last line). This allows the creation of the new Main Dataset without any name clashes with existing datasets:
[48]:
h5_cap_2 = usid.hdf_utils.write_main_dataset(h5_analysis_group,  # Parent HDF5 group
                                           np.random.rand(num_rows * num_cols, 1),  # Main Data
                                           'Mean_Capacitance',  # Name of Main Dataset
                                           'Capacitance',  # Physical quantity
                                           'pF',  # Units
                                           None,  # Position dimensions
                                           usid.Dimension('Capacitance', 'pF', 1),  # Spectroscopic dimensions
                                           h5_pos_inds=h5_pos_inds,
                                           h5_pos_vals=h5_pos_vals,
                                           aux_spec_prefix='Empty_Spec')
print(h5_cap_2)
<HDF5 dataset "Mean_Capacitance": shape (15, 1), type "<f8">
located at:
        /Measurement_000/Raw_Data-Normalization_000/Normalized_Data-Fitting_000/Mean_Capacitance
Data contains:
        Capacitance (pF)
Data dimensions and original shape:
Position Dimensions:
        Rows - size: 3
        Cols - size: 5
Spectroscopic Dimensions:
        Capacitance - size: 1
Data Type:
        float64
The compression argument need not be specified for small datasets such as Mean Capacitance. Clearly, Mean_Capacitance and Capacitance are two Main datasets that coexist in the same HDF5 group along with their necessary ancillary datasets.
Now, let us look at the contents of the group: Normalized_Data-Fitting_000 to verify this:
[49]:
sidpy.hdf_utils.print_tree(h5_analysis_group)
/Measurement_000/Raw_Data-Normalization_000/Normalized_Data-Fitting_000
├ Capacitance
├ Empty_Spec_Indices
├ Empty_Spec_Values
├ Mean_Capacitance
├ Position_Indices
├ Position_Values
├ Spectroscopic_Indices
├ Spectroscopic_Values
File status
is_editable_h5()
When writing a class or a function that modifies or adds data to an existing HDF5 file, it is a good idea to check to make sure that it is indeed possible to write the new data to the file. is_editable_h5() is a handy function for this very purpose:
[50]:
print('Is the file editable?: {}'.format(sidpy.hdf_utils.is_editable_h5(h5_file)))
Is the file editable?: True
If we close the file and try again we should expect runtime and Value errors. You can try this by yourself if you like
[51]:
h5_file.close()
# print('Is the file editable?: {}'.format(sidpy.hdf_utils.is_editable_h5(h5_file)))
Let us try again by opening this file in read-only mode. We should see that the file will not be editable:
[52]:
h5_file = h5py.File('test.h5', mode='r')
print('Is the file editable?: {}'.format(sidpy.hdf_utils.is_editable_h5(h5_file)))
Is the file editable?: False
Closing and deleting the file
[53]:
h5_file.close()
os.remove(file_path)
[ ]: