Hyperspectral Images
(Simultaneously acquired 2D images)
Suhas Somnath
10/12/2018
This example illustrates how a set of simultaneously acquired 2D grayscale images would be represented in the Universal Spectroscopy and Imaging Data (USID) schema and stored in a Hierarchical Data Format (HDF5) file, also referred to as the h5USID file. This example is based on the popular Atomic Force Microscopy scan mode where multiple sensors simultaneously acquire a value at each position on a 2D grid, thereby resulting in a 2D image per sensor. Specifically, the goal of this example
is to demonstrate the sharing of Ancillary datasets among multiple Main datasets.
This document is intended as a supplement to the explanation about the USID model
Please consider downloading this document as a Jupyter notebook using the button at the bottom of this document.
Prerequisites:
We recommend that you read about the USID model
We will be making use of the pyUSID package at multiple places to illustrate the central point. While it is recommended / a bonus, it is not absolutely necessary that the reader understands how the specific pyUSID functions work or why they were used in order to understand the data representation itself. Examples about these functions can be found in other documentation on pyUSID and the reader is encouraged to read the supplementary documents.
Import all necessary packages
The main packages necessary for this example are h5py, matplotlib, and sidpy, in addition to pyUSID:
[1]:
import subprocess
import sys
import os
import matplotlib.pyplot as plt
from warnings import warn
import h5py

%matplotlib inline

def install(package):
    subprocess.call([sys.executable, "-m", "pip", "install", package])


try:
    # This package is not part of anaconda and may need to be installed.
    import wget
except ImportError:
    warn('wget not found.  Will install with pip.')
    import pip
    install('wget')
    import wget

# Finally import pyUSID.
try:
    import pyUSID as usid
    import sidpy
except ImportError:
    warn('pyUSID not found.  Will install with pip.')
    import pip
    install('pyUSID')
    import sidpy
    import pyUSID as usid
Download the dataset
As mentioned earlier, this image is available on the USID repository and can be accessed directly as well. Here, we will simply download the file using wget:
[2]:
h5_path = 'temp.h5'
url = 'https://raw.githubusercontent.com/pycroscopy/USID/master/data/SingFreqPFM_0003.h5'
if os.path.exists(h5_path):
    os.remove(h5_path)
_ = wget.download(url, h5_path, bar=None)
Open the file
Lets open the file and look at its contents using sidpy.hdf_utils.print_tree()
[3]:
h5_file = h5py.File(h5_path, mode='r')
usid.hdf_utils.print_tree(h5_file)
/
├ Measurement_000
  ---------------
  ├ Channel_000
    -----------
    ├ Raw_Data
  ├ Channel_001
    -----------
    ├ Raw_Data
  ├ Channel_002
    -----------
    ├ Raw_Data
  ├ Channel_003
    -----------
    ├ Raw_Data
  ├ Position_Indices
  ├ Position_Values
  ├ Spectroscopic_Indices
  ├ Spectroscopic_Values
Notice that this file has multiple Channel, each with a dataset named Raw_Data. Are they all Main Dataset datasets? There are multiple ways to find out this. One approach is simply to ask pyUSID to list out all available Main datasets.
Visualize the contents in each of these channels
[4]:
for main_dset in usid.hdf_utils.get_all_main(h5_file):
    print(main_dset)
    print('---------------------------------------------------------------\n')
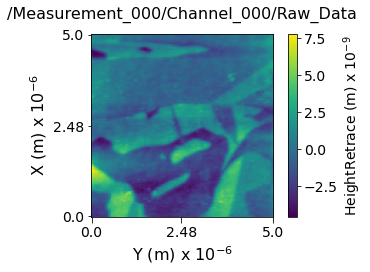
<HDF5 dataset "Raw_Data": shape (16384, 1), type "<f4">
located at:
/Measurement_000/Channel_000/Raw_Data
Data contains:
HeightRetrace (m)
Data dimensions and original shape:
Position Dimensions:
X - size: 128
Y - size: 128
Spectroscopic Dimensions:
arb - size: 1
Data Type:
float32
---------------------------------------------------------------
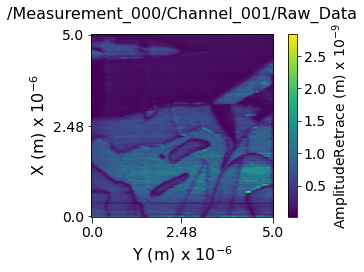
<HDF5 dataset "Raw_Data": shape (16384, 1), type "<f4">
located at:
/Measurement_000/Channel_001/Raw_Data
Data contains:
AmplitudeRetrace (m)
Data dimensions and original shape:
Position Dimensions:
X - size: 128
Y - size: 128
Spectroscopic Dimensions:
arb - size: 1
Data Type:
float32
---------------------------------------------------------------
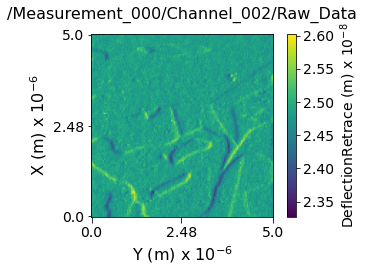
<HDF5 dataset "Raw_Data": shape (16384, 1), type "<f4">
located at:
/Measurement_000/Channel_002/Raw_Data
Data contains:
DeflectionRetrace (m)
Data dimensions and original shape:
Position Dimensions:
X - size: 128
Y - size: 128
Spectroscopic Dimensions:
arb - size: 1
Data Type:
float32
---------------------------------------------------------------
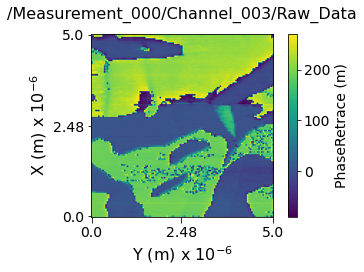
<HDF5 dataset "Raw_Data": shape (16384, 1), type "<f4">
located at:
/Measurement_000/Channel_003/Raw_Data
Data contains:
PhaseRetrace (m)
Data dimensions and original shape:
Position Dimensions:
X - size: 128
Y - size: 128
Spectroscopic Dimensions:
arb - size: 1
Data Type:
float32
---------------------------------------------------------------
From the print statements above, it is clear that each of these Raw_Data datasets were indeed Main datasets. How can these datasets be Main if they are not co-located with the corresponding sets of Ancillary datasets within each Channel group?
Sharing Ancillary Datasets
Since each of the Main datasets have the same position and spectroscopic dimensions, they share the same set of ancillary datasets that are under Measurement_000 group. This is common for Scanning Probe Microscopy scans where information from multiple sensors are recorded simultaneously during the scan.
Recall from the USID documentation that:
Multiple
Maindatasets can share the sameAncillarydatasetsThe
Maindatasets only need to haveattributesnamedPosition_Indices,Position_Values,Spectroscopic_Indices, andSpectroscopic_Valueswith the value set to the reference of the correspondingAncillarydatasets
We can investigate if this is indeed the case here. Lets get the references to Ancillary datasets linked to each of the Main datasets:
[5]:
for main_dset in usid.hdf_utils.get_all_main(h5_file):
    print('Main Dataset: {}'.format(main_dset.name))
    print('Position Indices: {}'.format(main_dset.h5_pos_inds.name))
    print('Position Values: {}'.format(main_dset.h5_pos_vals.name))
    print('Spectroscopic Indices: {}'.format(main_dset.h5_spec_inds.name))
    print('Spectroscopic Values: {}'.format(main_dset.h5_spec_vals.name))
    print('---------------------------------------------------------------\n')
Main Dataset: /Measurement_000/Channel_000/Raw_Data
Position Indices: /Measurement_000/Position_Indices
Position Values: /Measurement_000/Position_Values
Spectroscopic Indices: /Measurement_000/Spectroscopic_Indices
Spectroscopic Values: /Measurement_000/Spectroscopic_Values
---------------------------------------------------------------

Main Dataset: /Measurement_000/Channel_001/Raw_Data
Position Indices: /Measurement_000/Position_Indices
Position Values: /Measurement_000/Position_Values
Spectroscopic Indices: /Measurement_000/Spectroscopic_Indices
Spectroscopic Values: /Measurement_000/Spectroscopic_Values
---------------------------------------------------------------

Main Dataset: /Measurement_000/Channel_002/Raw_Data
Position Indices: /Measurement_000/Position_Indices
Position Values: /Measurement_000/Position_Values
Spectroscopic Indices: /Measurement_000/Spectroscopic_Indices
Spectroscopic Values: /Measurement_000/Spectroscopic_Values
---------------------------------------------------------------

Main Dataset: /Measurement_000/Channel_003/Raw_Data
Position Indices: /Measurement_000/Position_Indices
Position Values: /Measurement_000/Position_Values
Spectroscopic Indices: /Measurement_000/Spectroscopic_Indices
Spectroscopic Values: /Measurement_000/Spectroscopic_Values
---------------------------------------------------------------
From above, we see that all the Main datasets we indeed referencing the same set of Ancillary Datasets. Note that it would not have been wrong to store (duplicate copies of) the Ancillary datasets within each Channel group. The data was stored in this manner since it is more efficient and because it was known apriori that all Main datasets are dimensionally equal. Also note that this sharing of Ancillary datasets is OK even though the physical quantity and units
within each Main dataset are different since these two pieces of information are stored in the attributes of the Main datasets (which are unique and independent) and not in the Ancillary datasets.
The discussion regarding the contents of the Ancillary datasets are identical to that for the 2D grayscale image and will not be discussed here for brevity.
Visualizing the contents within each channel
Now lets visualize the contents within this Main Dataset using the USIDataset's built-in visualize() function.
[6]:
usid.plot_utils.use_nice_plot_params()
for main_dset in usid.hdf_utils.get_all_main(h5_file):
    main_dset.visualize(num_ticks=3)
Clean up
Finally lets close and delete the example HDF5 file
[7]:
h5_file.close()
os.remove(h5_path)